If you’ve been running a Go High Level pipeline for more than a few months, you’ve probably noticed something uncomfortable: not every lead that enters the pipeline becomes a conversation, and not every conversation becomes a deal.
That’s expected. What’s less expected is discovering where exactly leads are being lost — and realizing how many of those losses have nothing to do with lead quality or pricing.
This guide covers how to analyze your GHL pipeline to identify where leads stall, what’s causing it, and how to build automations that fix the structural problems.

The Most Common Finding: Follow-Up Failures Disguised as Bad Leads
When businesses first analyze their pipeline, the assumption is usually that poor results are caused by bad leads or difficult market conditions.
The data often tells a different story.
In many pipelines, a large percentage of non-converting leads become stuck in early stages such as Contact Attempted or Connected. The issue isn’t lead quality — it’s inconsistent follow-up.
In one mature GHL pipeline analysis, 67% of all non-converting leads were found stalled in just two stages. Most losses occurred because communication stopped, not because prospects chose a competitor.
Leads don’t always leave. Often, they’re simply forgotten.
Step 1: Run the Stage Stall Analysis
Use GHL pipeline reporting to answer these questions for every stage:
- Average time in stage — How long does a contact remain in the stage?
- Exit rate by direction — What percentage move forward versus become lost?
- Pipeline value by stage — Which stages contain the most open revenue?
If one stage has a significantly higher average time than the others, you’ve identified a bottleneck.
If a stage has a high loss rate, that’s where your process is breaking down.
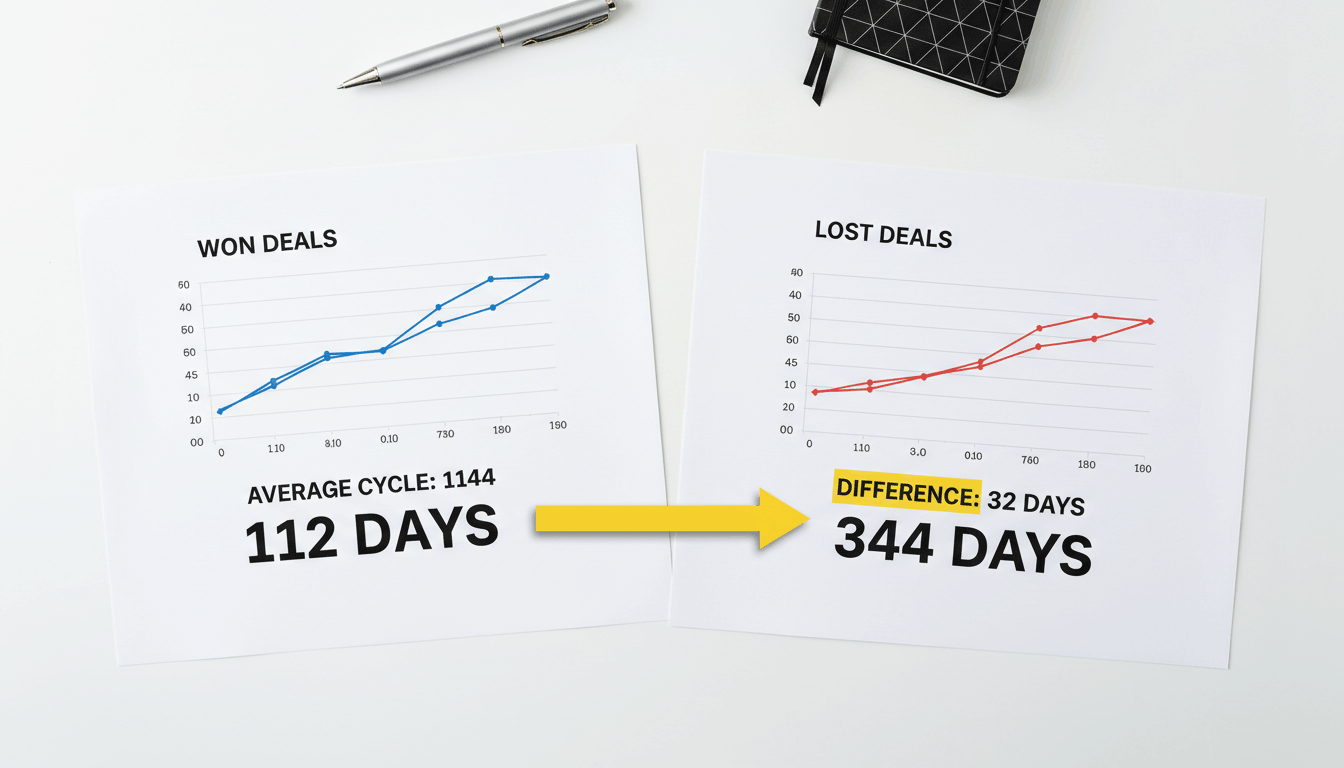
Step 2: Segment Won vs. Lost by Stage
Compare your won opportunities against your lost opportunities.
- Which stages do successful deals move through fastest?
- Which stages do lost deals commonly stall in?
Many businesses discover findings similar to:
- Won deals average 112 days from first contact to close.
- Lost deals average 144 days from first contact to loss.
That 32-day difference often represents delayed follow-up, reduced urgency, increased competition, and shifting buyer priorities.
Step 3: Look at Rep-Level Distribution
Review pipeline performance by sales representative.
- Rep A: 200 opportunities, 9.2% close rate
- Rep B: 350 opportunities, 4.8% close rate
- Rep C: 180 opportunities, 7.1% close rate
High-volume, low-conversion reps require different coaching than low-volume, high-conversion reps.
This analysis helps managers allocate leads more effectively and identify where coaching can produce the biggest improvements.
Step 4: Geographic Analysis
If your business operates across multiple regions, analyze conversion rates by geography.
Example:
- State A: 113 opportunities, 0 wins
- State B: 47 opportunities, 14.9% win rate
- State C: 38 opportunities, 13.0% win rate
- State D: Highest average deal value
Many businesses discover they’re spending advertising dollars in markets that consistently fail to convert.
By reallocating budget toward higher-performing regions, marketing efficiency often improves immediately.
The Fixes: Building Anti-Stall Automation
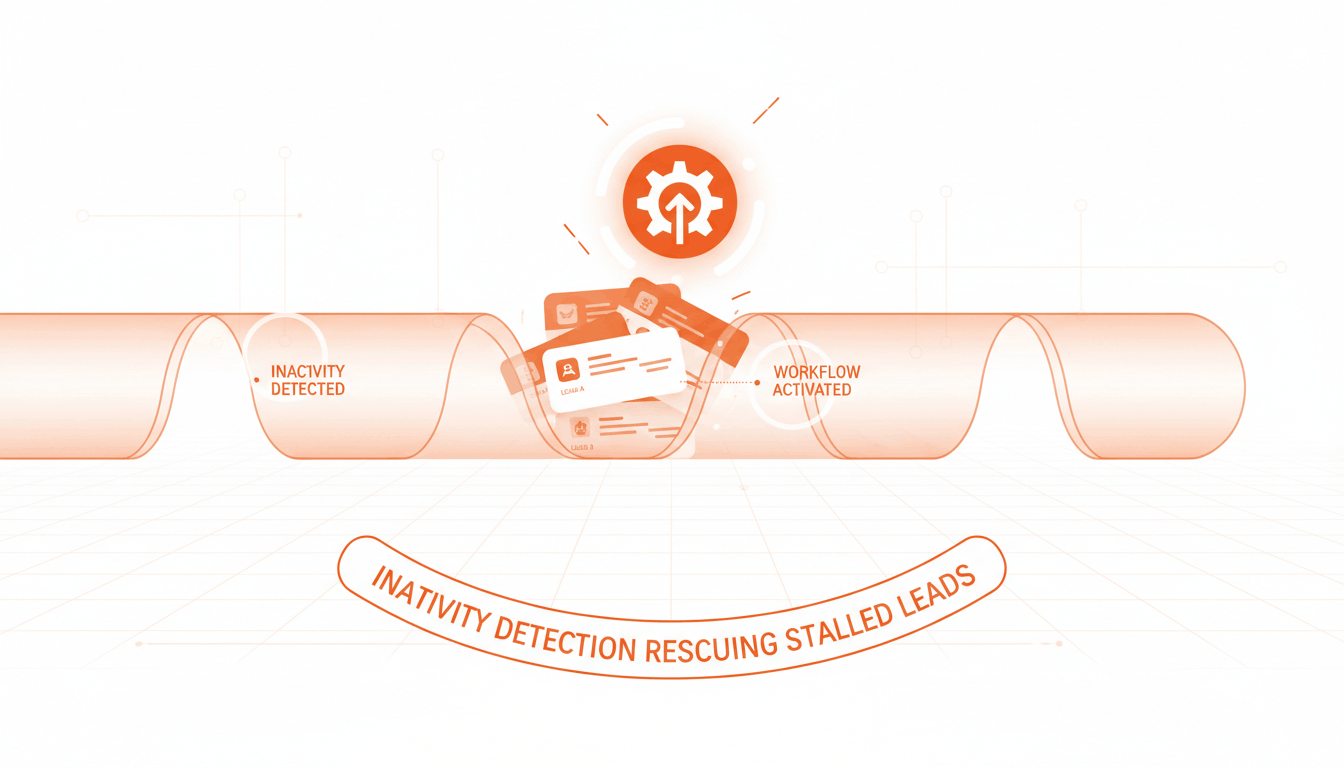
Fix 1: Inactivity Detection Workflow
Problem: Leads remain in Contact Attempted or Connected stages without activity.
Workflow:
- Trigger when an opportunity remains in the same stage for 7 days.
- Create a reminder task for the assigned rep.
- Send an automated follow-up message to the prospect.
- Escalate to a manager after 14 days of inactivity.
Fix 2: Long-Cadence Nurture for “Not Now” Leads
Problem: Interested prospects are marked lost and forgotten.
Workflow:
- Move the opportunity to a Future Deals stage.
- Enroll the contact in a six-month nurture sequence.
- Create a rep follow-up task at the six-month mark.
Fix 3: Rep-Level Inactivity Alerts
Problem: Managers don’t know follow-up has stopped until the opportunity is effectively dead.
Workflow:
- Trigger after 5 business days without logged activity.
- Notify the manager with opportunity details.
- Create an action item for the assigned rep.
Fix 4: Post-Loss Re-Engagement
Problem: Lost opportunities disappear permanently.
Workflow:
- Enroll lost opportunities in a 90-day re-engagement sequence.
- Create a personal follow-up task after 90 days.
- Move prospects to a long-term nurture campaign after 180 days.
Tracking Sales Cycle Time as a Leading Indicator
Once anti-stall automations are in place, monitor average days-to-close by representative.
If deal age continues increasing, it’s often an early warning sign of pipeline stagnation.
When average sales cycle length decreases, it’s usually evidence that follow-up processes are improving and buyers are making decisions faster.
Sales cycle time is one of the most useful leading indicators available inside a GHL pipeline.
The Business Outcome
When businesses combine pipeline analysis with targeted automation, several improvements typically follow:
- Fewer forgotten leads — Automated inactivity detection keeps opportunities active.
- More recovered opportunities — Re-engagement workflows revive prospects that would otherwise be abandoned.
- Better coaching — Managers can coach based on actual bottlenecks instead of assumptions.
- Smarter budget allocation — Geographic and source-level analysis reveals where marketing dollars perform best.
The data already exists inside Go High Level. The value comes from organizing it into actionable insights and building automations that prevent leads from slipping through the cracks.
Final Thoughts
Most lead losses are not competitive losses. They’re process losses.
By identifying where opportunities stall, measuring stage-level performance, and deploying anti-stall automation, businesses can recover revenue that would otherwise disappear unnoticed.
The goal isn’t simply generating more leads. It’s ensuring the leads you already have receive the follow-up they deserve.